
Scottie Scheffler's True Strokes Gained: 12th Since 1983
His 2026 rates as the 12th-best statistical season in 43 years, and eight above it belong to Tiger Woods. What the number does and doesn't say.
Key Takeaways
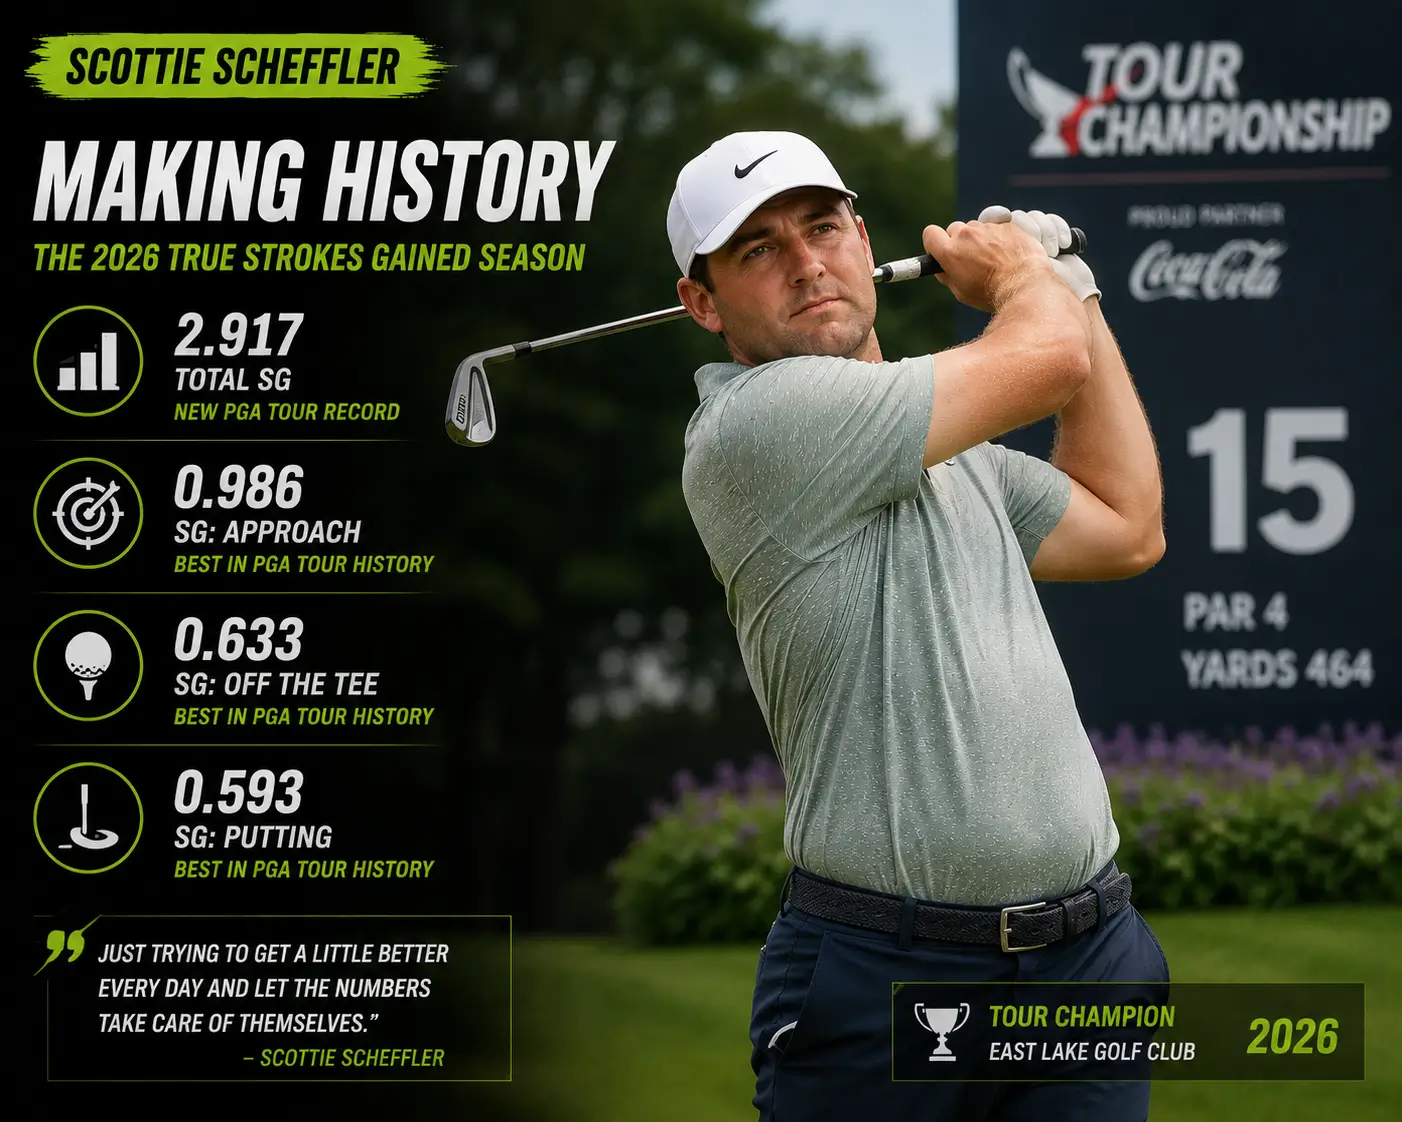
- True Strokes Gained places Scheffler's 2026 at #12 since 1983, even though his raw PGA TOUR SG rate is +2.374.
- The adjusted number accounts for field strength; it is a historical comparison, not a replacement for the PGA TOUR leaderboard.
- Three wins, five runner-ups and a second-place FedExCup finish can coexist with a lower historical rate than Scheffler's 2025 season.
Historical True Strokes Gained & Season Metrics
| Rank (Since 1983) | Player / Season | True SG/Rd | Profile |
|---|---|---|---|
| #1–#6 | Tiger Woods (Peak Era) | +3.40 to +3.80+ | Major dominance & historic wins |
| #7 | Scottie Scheffler (2025) | +3.28 | 7 wins, Olympic Gold, Masters title |
| #8–#11 | Tiger Woods (2 seasons), Greg Norman (1), Scheffler (1) | +3.00 to +3.20 | Elite conversion & field separation |
| #12 | Scottie Scheffler (2026) | +2.92 (PGA Tour Raw: +2.374) | 3 wins, 5 runner-ups, 2nd FedExCup |
Defining True Strokes Gained vs Raw PGA Tour SG
Raw Strokes Gained asks how many shots a player gained or lost against the field in the events he played. True Strokes Gained goes one step further by adjusting the comparison for field strength, which makes a week against a deep major or signature-event field different from a week against a weaker field.
The PGA TOUR's Scheffler comparison identifies the distinction and reports his 2025 True SG at +3.28, the seventh-best season since 1983. Data Golf's player profile is the underlying place to inspect the model and its season context.
The DG Points Dilemma
Data Golf points and strokes gained rates answer different questions. Points reward what happened in the standings: wins, high finishes and the strength of the event. A player can accumulate fewer points than expected while still producing exceptional shots if five runner-up finishes replace the wins a conversion model would predict.
That is the tension in Scheffler's 2026. A second-place FedExCup finish and five runner-ups describe a season that kept reaching the final groups. The True SG rate describes the quality of every shot across the sample. One measures competitive conversion; the other isolates performance per round.
The Bounce-Back Rate Collapse
The sharpest year-over-year warning is not the ranking of 12th. It is the bounce-back rate: Scheffler fell from first on Tour in 2025 to 66th in 2026. The slower Thursday starts fit that pattern. An elite player can still build a historic season while spending more of the week recovering from an opening deficit.
That is why the word “collapse” needs care. It describes the rate of recovering from a poor opening position, not a collapse in total quality. The broader 2026 profile remains too strong for that conclusion: the rate is lower than 2025, but it is still historically rare.
The Rate Stats vs Counting Stats Debate
Counting stats reward the volume of a season; rate stats show how well the player performed while on the course. Scheffler led in SG Total (2.374), SG Tee-to-Green (1.694), GIR (72.9%) and Scoring Average (67.9), and ranked third in Putting (.680).
Those numbers explain why the 12th-place historical ranking is not a verdict that Scheffler declined into normal territory. He can have a lower adjusted rate than in 2025 and still lead the active field in multiple raw categories. The official PGA TOUR comparison puts those year-over-year ranks beside the Data Golf adjustment; it is the combination, not either column alone, that describes the season.
5 Golf Analytics Myths Debunked
- “#12 means Scheffler's season was ordinary.” No. Twelve seasons in 43 years is an extraordinary historical cut; the comparison is against peak Tiger, Norman and Scheffler years.
- “Raw SG and True SG are the same stat.” They are not. True SG adjusts for the strength of the fields being faced.
- “Tiger's best seasons make all modern comparisons pointless.” The point of the adjusted series is precisely to place different eras on one framework, with its limits made visible.
- “Two or three wins makes 2026 a down year.” Wins are counting outcomes. They do not erase five runner-ups, elite tee-to-green play or a second-place FedExCup finish.
- “A model ranking tells us who won each Sunday.” It does not. True SG is a descriptive comparison of shot quality, not a replacement for tournaments, titles or context.
The Raw Verdict
Scheffler's 2026 is not the season the win column would have predicted, and it is not the season a single adjusted ranking can summarize. At +2.92 True SG per round, it sits 12th since 1983. That is a step below his own 2025 peak, but still one of the best seasons the model has found. The useful conclusion is not “down year.” It is that the standard moved again.
Frequently Asked Questions
What is Scottie Scheffler's True Strokes Gained ranking for 2026?
Data Golf rates his 2026 season 12th among True Strokes Gained seasons since 1983, at approximately +2.92 shots per round.
How is True Strokes Gained different from raw PGA TOUR SG?
Raw SG compares a player with the field in the events played. True SG adjusts that result for the strength of the field, helping compare performances across different schedules and eras.
Does 12th place mean Scheffler had a bad season?
No. It means 11 historical seasons rate higher in this model. Scheffler's 2026 still includes three wins, five runner-ups, elite raw statistics and a second-place FedExCup finish.
Sources
- PGA TOUR: What’s different (not wrong) with Scottie Scheffler in 2026?
- Data Golf: Scottie Scheffler player profile and True Strokes Gained
- Data Golf: Career Evolutions methodology and since-1983 comparison
- PGA TOUR: 2026 Tour Championship leaderboard
Read the Scheffler and Ted Scott strategy breakdown, Hovland's Tour Championship runner-up analysis, or the Scheffler and Brandel Chamblee arc.